For as long as I remember, I always have loved ranking charts. Ranking charts of all sorts, really. On this page I Share charts I created, or that I find insightful.
Ranking Charts
Disclosure: All opinions on the below charts represent just my or the opinions of others. Please always do your own research, and don’t rely on the information provided on this page.
Table of Contents
Why Do I Love Ranking Charts?
When I was young, I and my friends spent hours and loved coming up with rankings of all sorts, such as
- Top 10 best songs
- 5 Tallest Mountains in Europe
- The 10 world’s biggest cities
- The 10 most stupid inventions
- etc.
This seems to be a lifelong passion of mine, as even today, I love ranking charts and this is especially true when it comes to investing.
Ranking charts provide you with clear and easy-to-digest information, help you to cut through the noise, and the best, they let you grasp the big picture by giving you a quick overview of a specific category.
Dividend Stock Ranking Charts
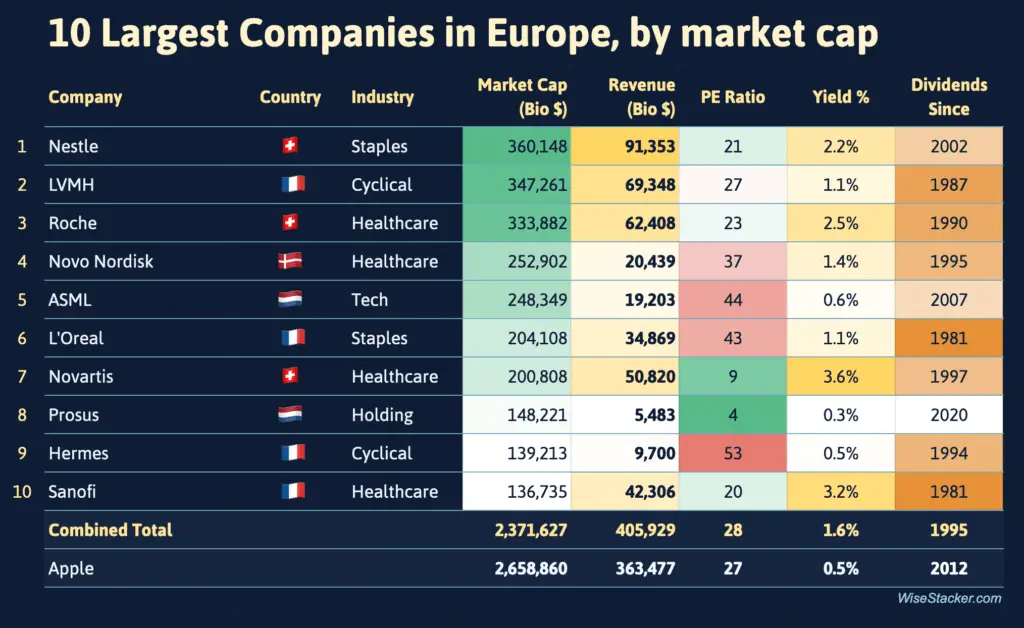
10 Largest Companies in Europe, by market cap
A few things surprised me:
1/ Total combined market cap of all 10 most valuable companies in the E.U. is still 10% less than that of Apple!
2/ No German
3/ Two dividend payers with +40 years of continuous dividend payments – nice.
4/ For long-term #passiveincome investors like myself, #Novartis looks interesting here: has the highest yield (3.6%), and a PE of 9.
5/ My All-Weather Portfolio does not contain any of the E.U.’s 10 largest companies. Hm. The one I like most is actually Novo Nordisk.
In general, I see good opportunities in the E.U. at the moment. But uncertainty is too high. Will sit tight and wait.
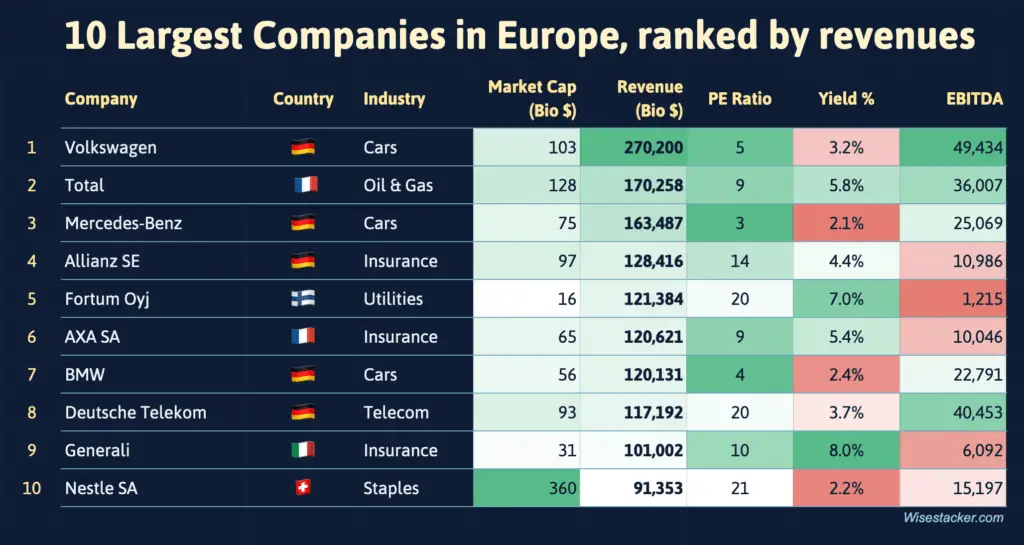
10 Largest Companies in Europe, by revenues
Also here few surprises:
1/ When looking at which companies with highest revenues, we find 5x German companies, but none of those are in the Top 10 market cap (see above)
2/ Of the Top 10, I only own Allianz in my All-Weather Portfolio
3/ I suppose one out of a million people would have known that the 5th largest company by revenue in the E.U. is a company called Fortum Oyj.
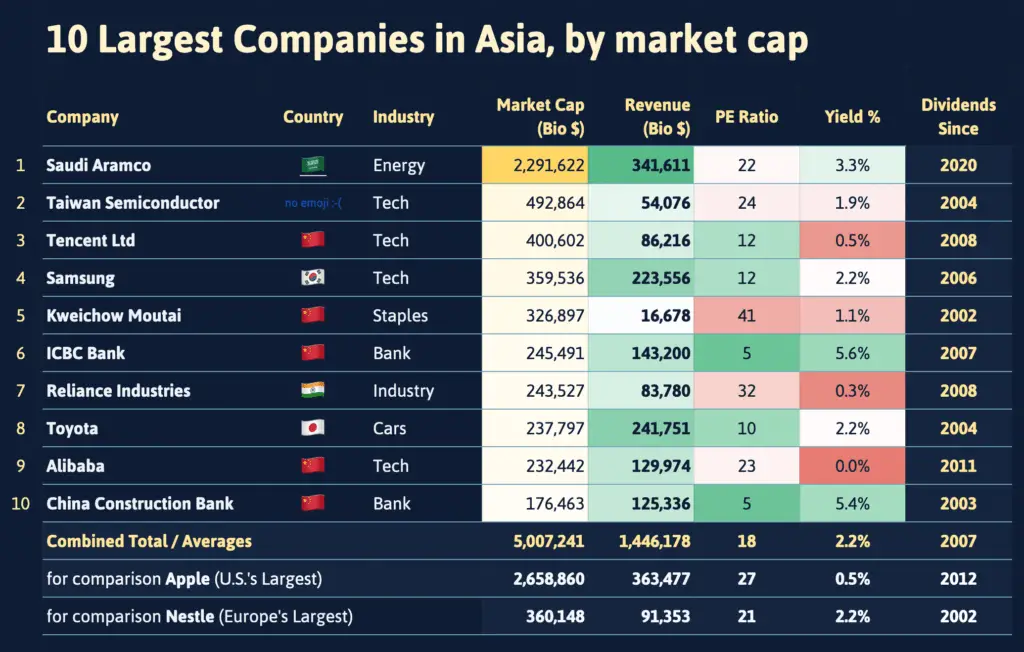
10 Largest Companies in Asia, ranked by market cap
A few observations:
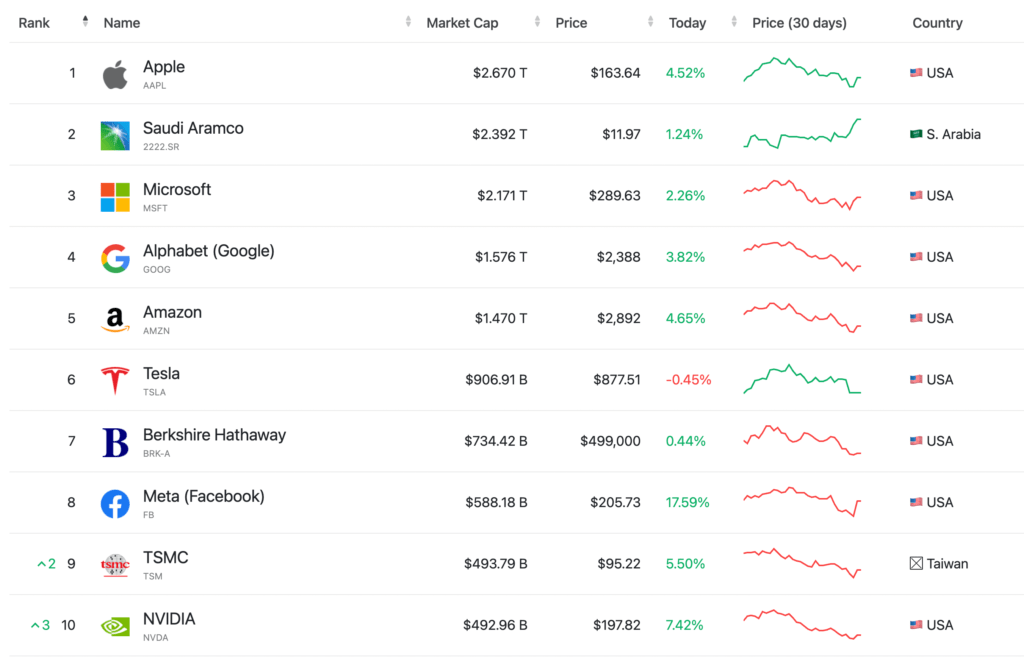
1/ Saudi Aramco is HUGE. As large as the next 6 biggest companies in Asia –combined– (!), with a similar revenue as Apple!
2/ 5 Companies are from China, only one from Japan. Surprising!
3/ Of Asia’s Top 10, I own Tencent and Alibaba in my All-Weather Portfolio.
4/ If you’d put Nestle, Europe’s largest company by market cap, into Asia, it would take the 4th spot.
5/ The Chinese banks have extremely low PEs and good dividend yields.
Overall, as a long-term passive income and dividend lover, I believe Samsung looks good here. But it’s tech, and I generally don’t consider tech stocks for my ultra-long portfolio. Too difficult.
I love hunting for the world’s best high yield dividend stocks. Click 👉 here to see how I do so.
10 Largest Companies In The World, by market cap (2022 April)
Investment & Market Ranking Charts
U.S. Fed Balance Sheet Vs S&P500 Index
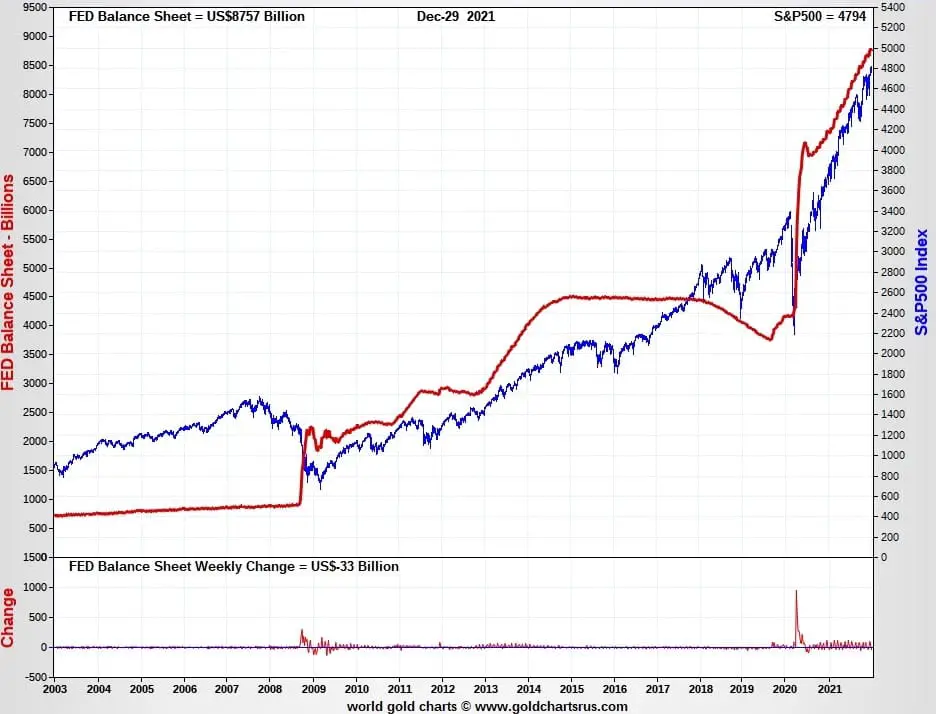
What a fantastic chart – basically the last twenty years of stock market performance explained!
U.S. Fed Balance Sheet Vs S&P500 Index
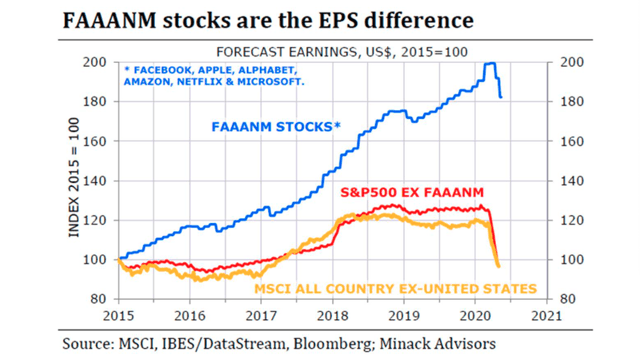
If you’d remove the six FAAANM stocks (Facebook, Apple, Alphabet, Amazon, Netflix and Microsoft), the earnings-per-share for the S&P500 or your MSCI World would essentially be where you were in 2015!
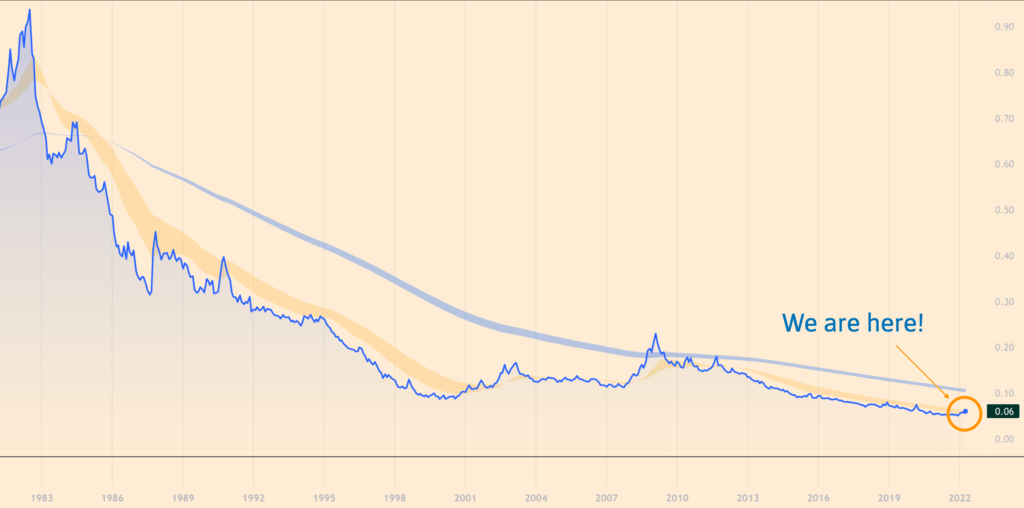
Consumer Price Index / SPY500 (All Commodities)
Super long-term chart going back to the 1980s, showing the Consumer Price Index of all commodities measured in SPY500. This shows that either all commodities are monumentally undervalued, or that the SP500 is extremely overvalued. You can find the Consumer Price Index on Tradingview via this ticker: PPIACO.
Read also:
- Why I invest in commodities – 15x great stocks for the coming commodity super cycle
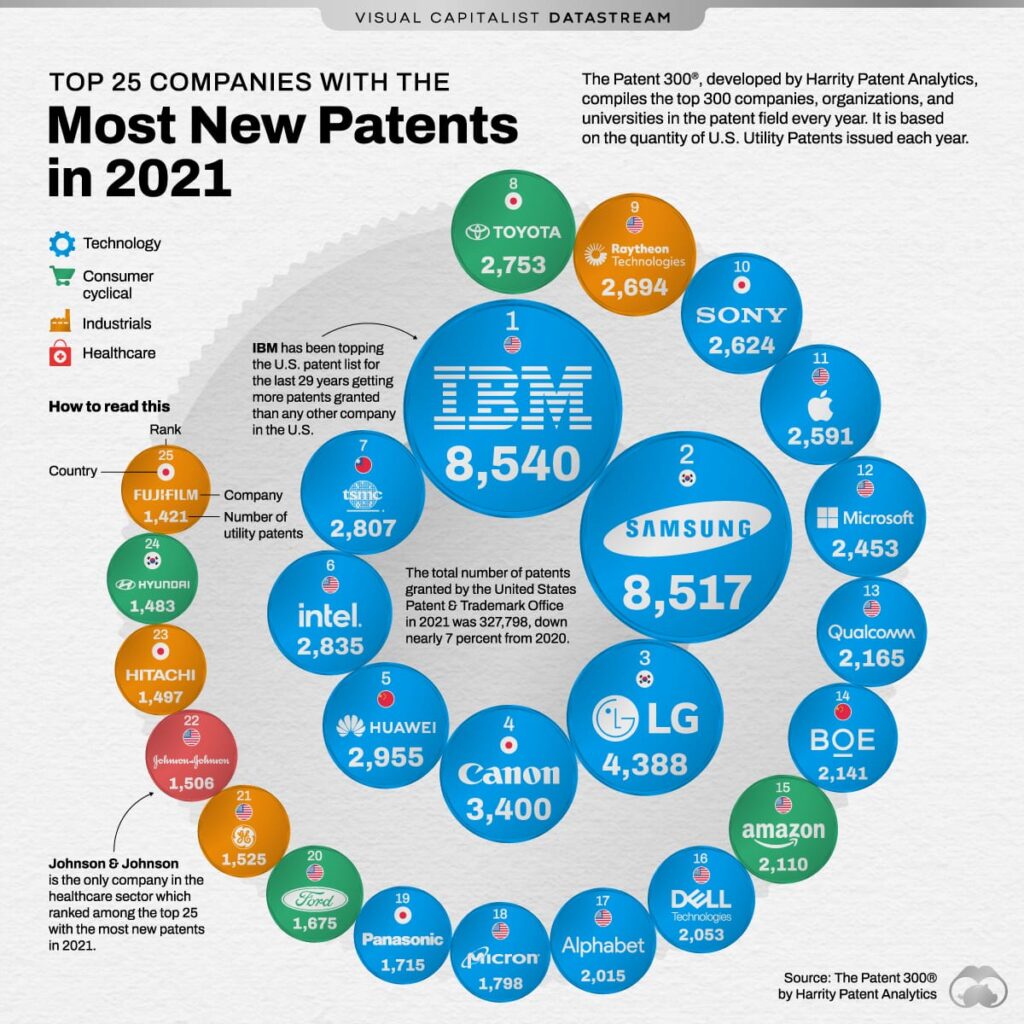
Top 25 Companies With Most Patents Granted, in 2021
–> Link
1/ Who thought IBM got 8,540 patents granted just within one year (that`s 23 granted patents per day!)
2/ Of the top 10 companies, 7 are from Asia, three from the U.S.
3/ I am not 100% sure, but I believe there is no European company due to the fact that they might go through the European patent office
4/ I own Qualcomm in my Metaverse Portfolio (via the Roundhill Metaverdse ETF)
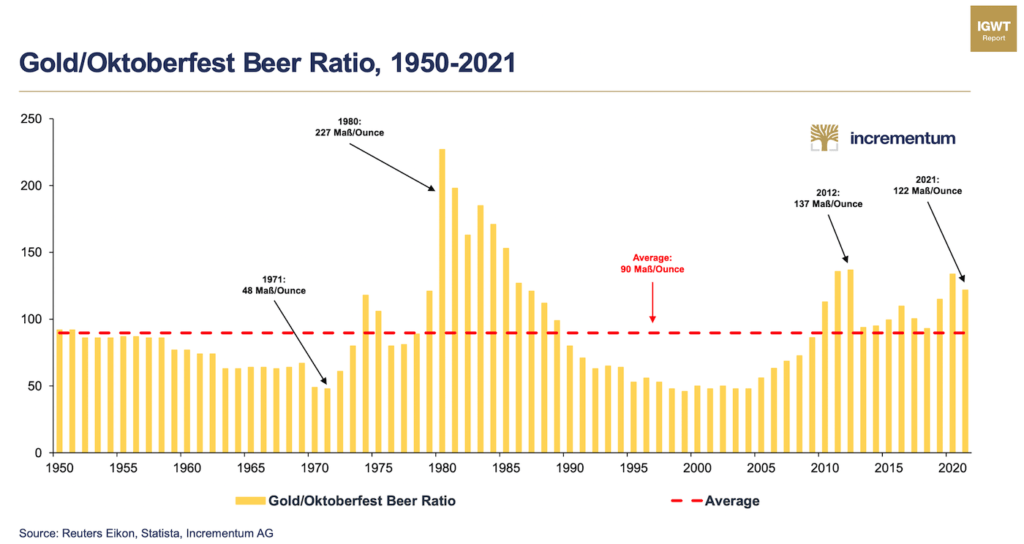
The Gold / Oktoberfest Beer Ratio
A fantastic chart from the Incrementum AG, publishers of the yearly In Gold We Trust Report, showing how many Maß (=1L of beer) you can buy with one ounce of gold at the Oktoberfest in Munich. As you can see with one ounce of gold you can still buy the same amount of Maß as 70 years ago, but looking at the Euro just in the past 20 years, it’s a different story, see below.
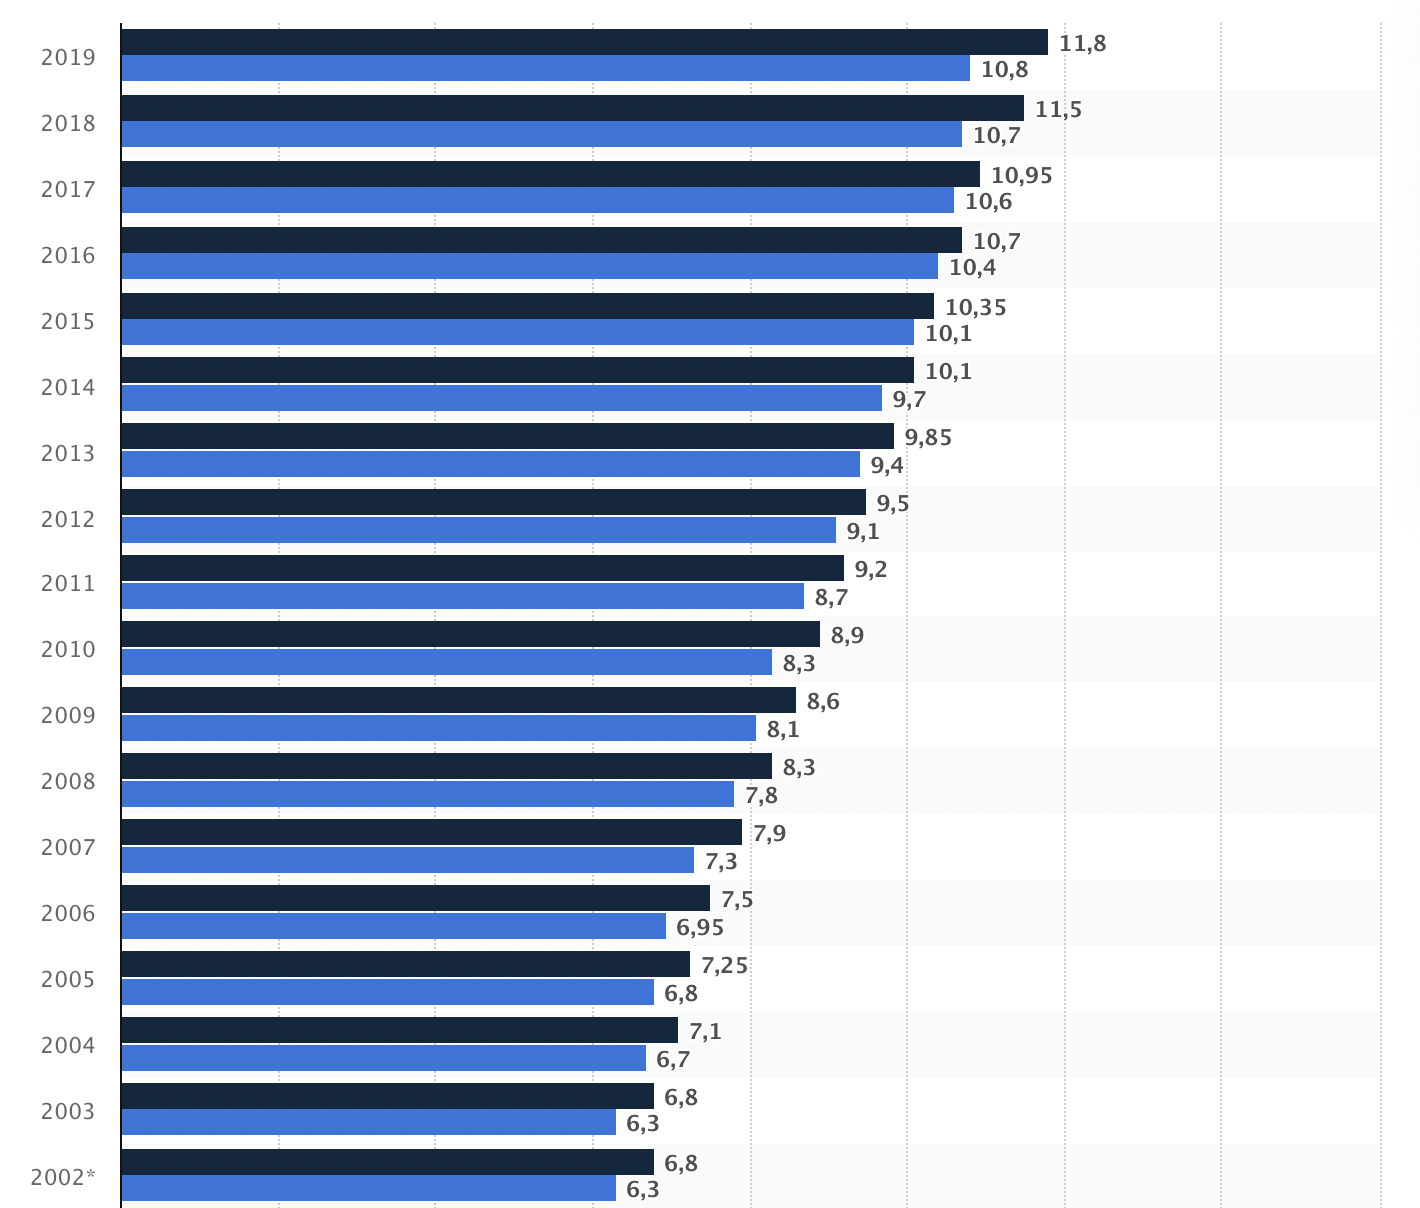
Source: Statista.com
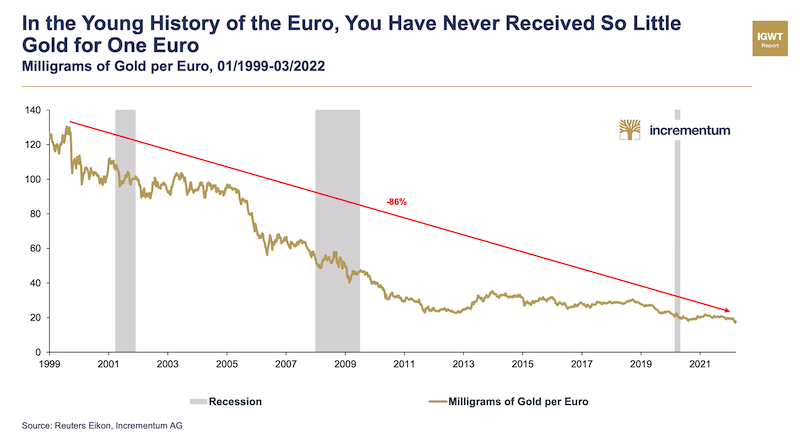
This collapse of the Euro’s purchasing power is also visible on another excellent chart from Incrementum, see below. It shows the amount of gold you can buy with one Euro, compared over the years.
Read Also:
- How to properly store precious metals at home
Recent Posts
Subscribe
Connect withD
Login
I allow to create an account
When you login first time using a Social Login button, we collect your account public profile information shared by Social Login provider, based on your privacy settings. We also get your email address to automatically create an account for you in our website. Once your account is created, you'll be logged-in to this account.
DisagreeAgree
Connect withD
I allow to create an account
When you login first time using a Social Login button, we collect your account public profile information shared by Social Login provider, based on your privacy settings. We also get your email address to automatically create an account for you in our website. Once your account is created, you'll be logged-in to this account.
DisagreeAgree
0 Comments
Inline Feedbacks
View all comments

