
Key Takeaways
✅ TradingView Charts are good tools investors should use
✅ Keep it simple and limit the time you spend on it
✅ Every investor draws different conclusions
✅ Best to follow a certain set of best practices
Intro
A fellow investor and reader of my blog recently asked me “What TradingView chart settings do you like and use the most“?
I am a big fan of TradingView and with the following post, I’ll share what chart settings and indicators I like best.
My Basic TradingView Chart Settings
When looking to find good times to buy or add to positions, I use the following simple chart settings:
- Heikin Ashi (I prefer their smoother appearance as they track a range of price movements, explainer here)
- 50 Day Simple Moving Average / 50SMA
- 200 Day Simple Moving Average / 200SMA
- Relative Strenght Index / RSI (explained here)
Best 10 Tips On Technical Analysis
1️⃣ Be on the right side of the ‘V’.
2️⃣ Let prices come to you – don’t chase or front-run prices.
3️⃣ Nothing good happens below the 200-day moving average (go into hibernation mode).
4️⃣ We want the meat in the middle, not the exact top & bottom 🍔.
5️⃣ When in doubt, stay out.
6️⃣ All pigs can fly if shot out of a large enough canon, but they all return to earth as bacon 🥓.
7️⃣ More money was lost trying to chase yield, than at gunpoint.
8️⃣ Plan your trade, and trade your plan.
9️⃣ To boys: Don’t just sit there; do something. To investors: Don’t just do something; sit there.
🔟 It wasn’t my being right that caused me to get wealthy, it was my sitting tight.
I am a subscriber to their Essential Plan (get $15 US off with this link!), and I estimate I spend about 1 hour a day on TradingView. I
Best Practices When Investing In Dividend Stocks
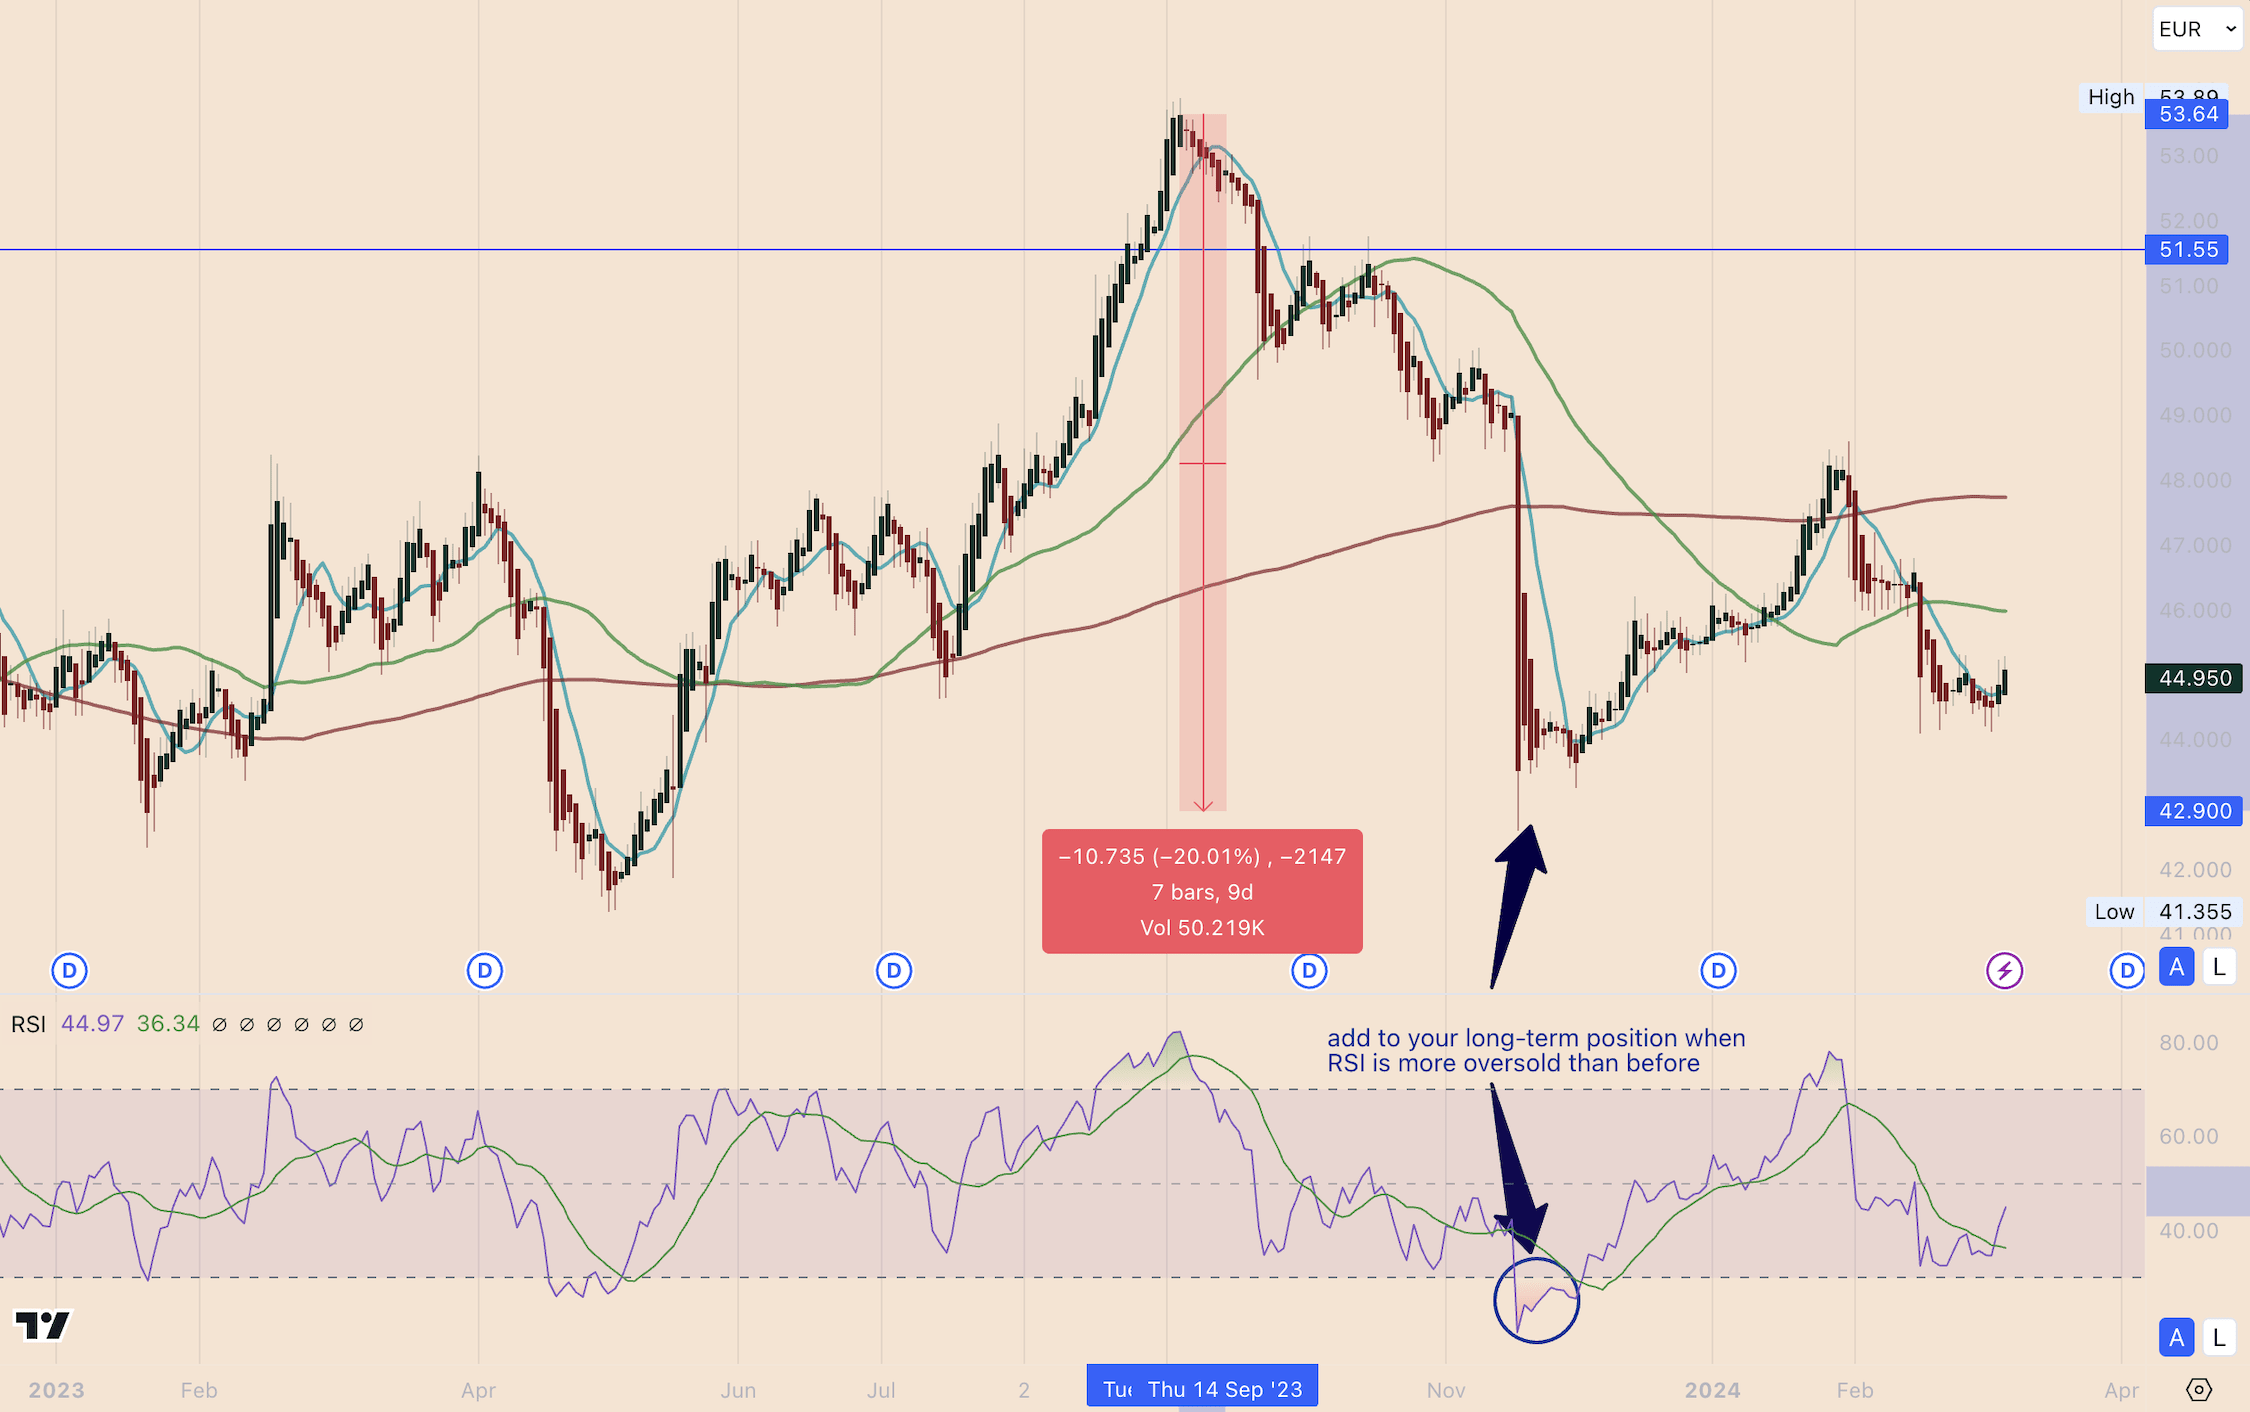
Make Use Of Opportunities
For long-term investors like myself, planning to own a stock for decades, I try to make use of opportunities when they present themselves.
See Cisco’s chart (CSCO) below – when the stock was sold off due to an insignificant earnings miss, I added to my position when I saw the RSI was extremely low/oversold.
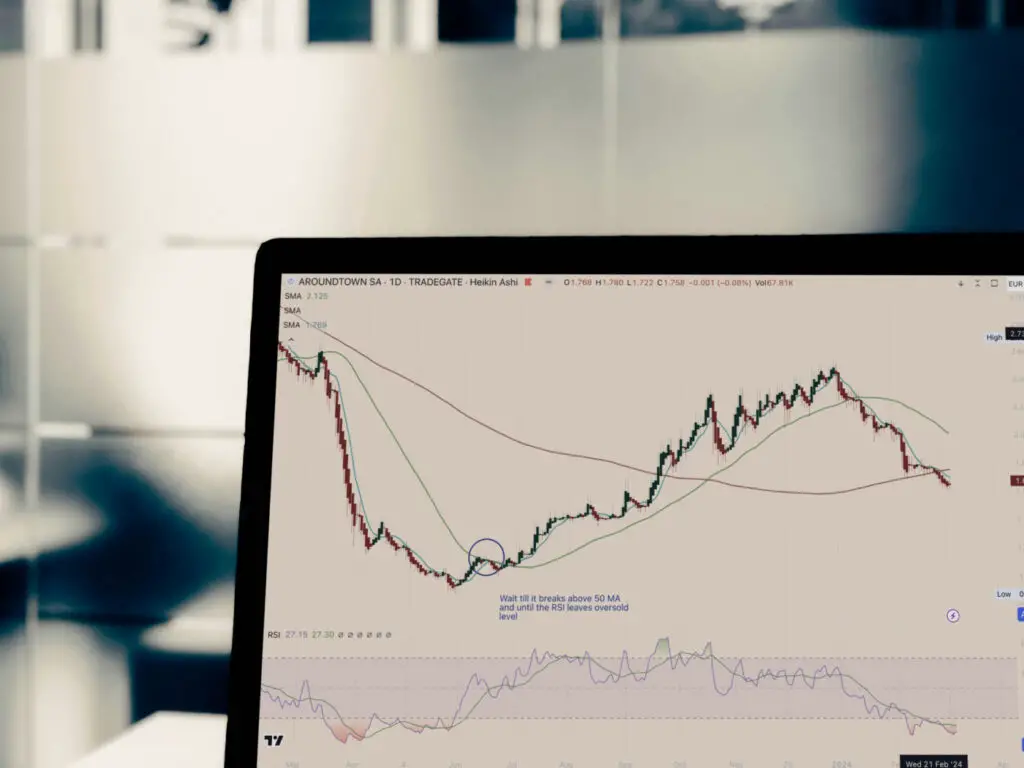
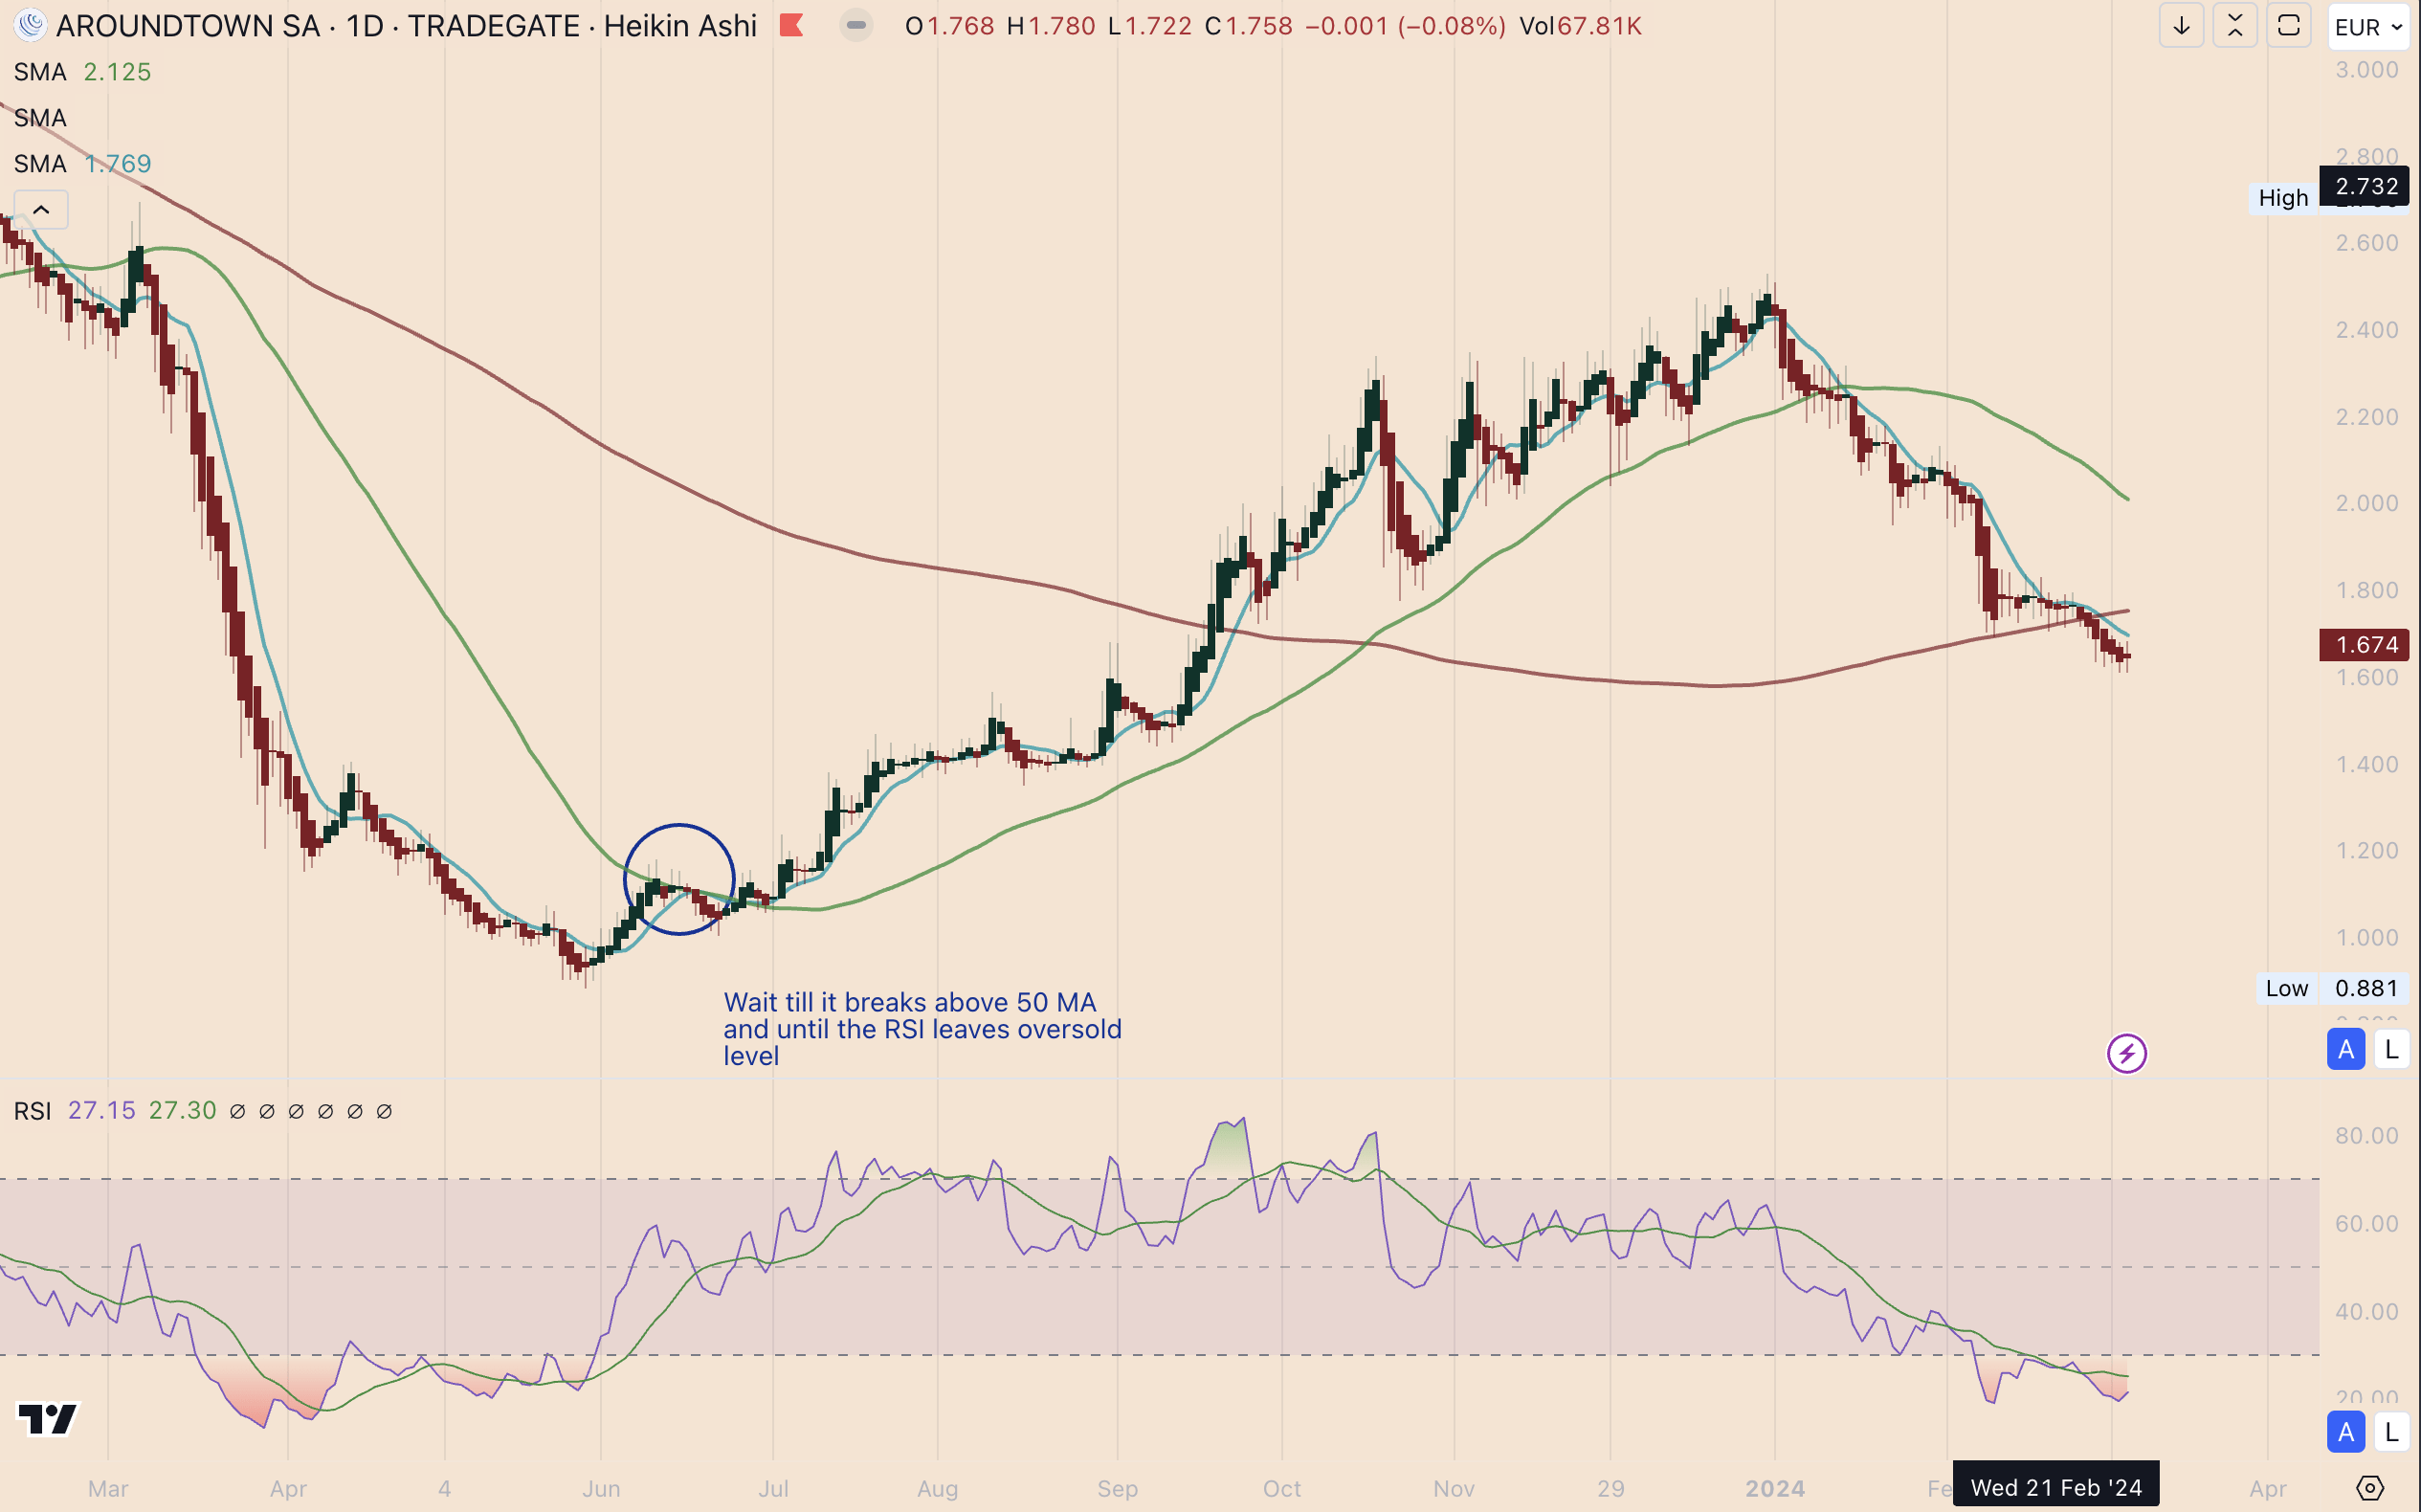
Alternative Strategy – Wait Till The Dust Settles
If you are not sure if the dump is over, wait till the share price can cross the 50SMA, see below Aroundtown’s chart (AANNF).
Be On The Right Side Of The V
One of my first trading mentors always said ‘Don’t be on the left side of the V, only be on the right side‘.
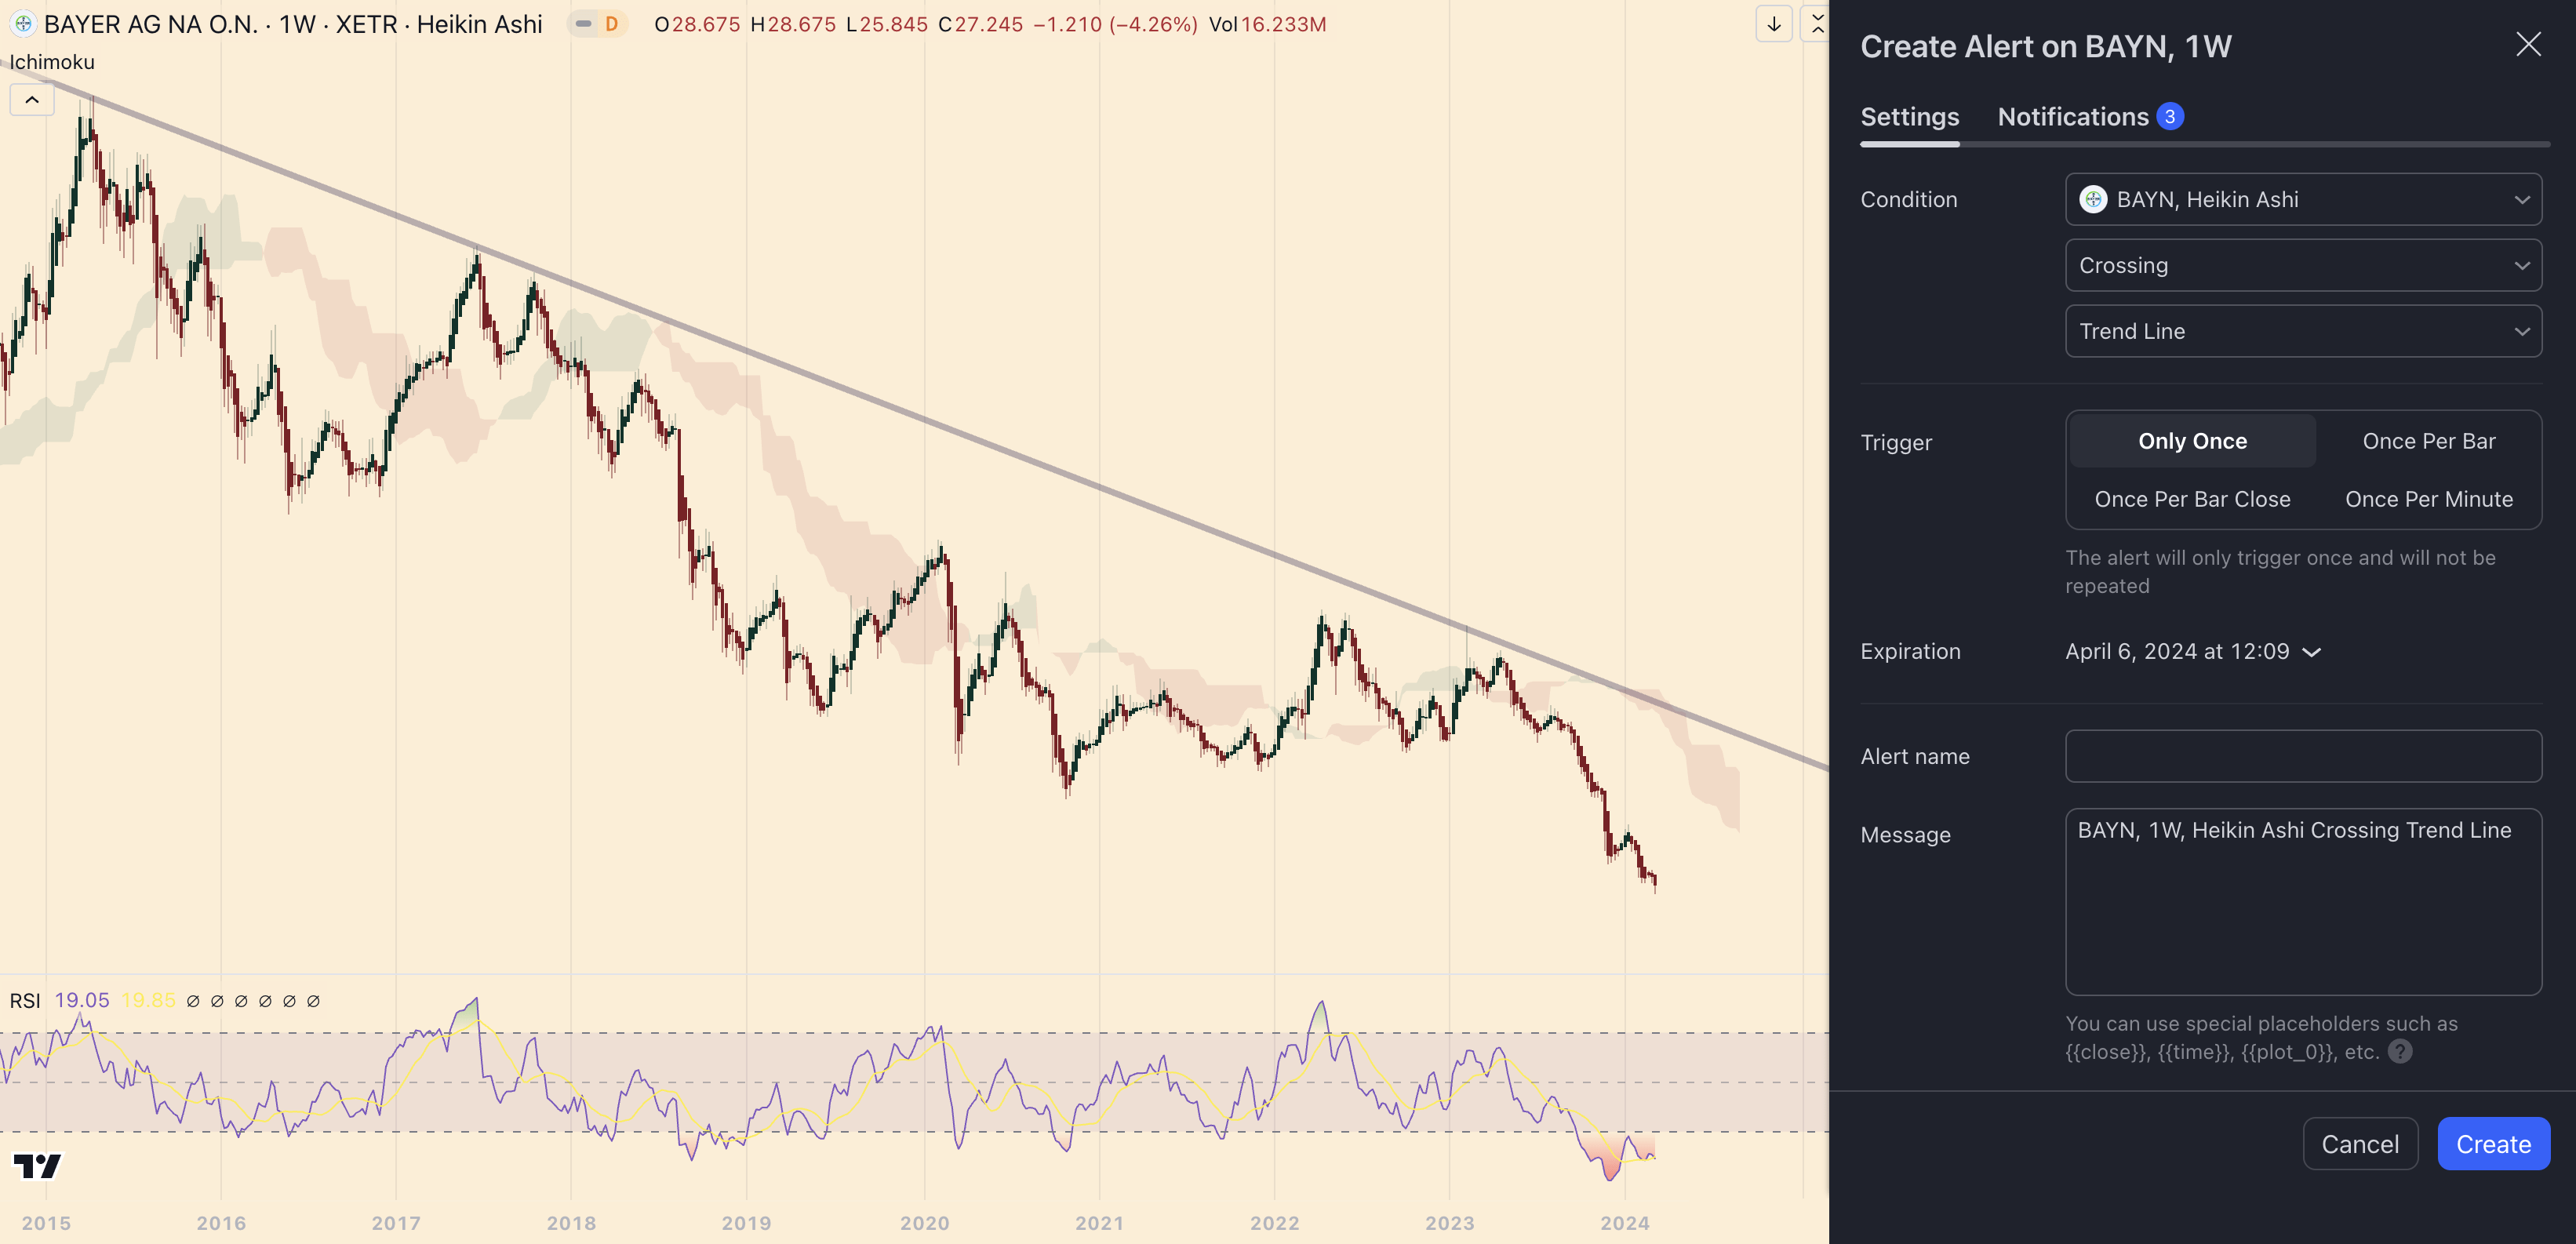
Look at the stock chart of the German pharma giant Bayer (BAYRY).
A steady downtrend, and that since 2015! Don’t even think about buying this non-starter until it proves to you that it was able to cross through the wakeup line.
I love TradingView’s alert settings. Right-click on the stock chart, and set an alert whenever it crosses through!
Wait For The Breakout
I own 100x shares of one of my favorite financial dividend stocks, Allianz (ALIZY).
From 2020-2024, it tried four times to break through 233€. See the chart below.
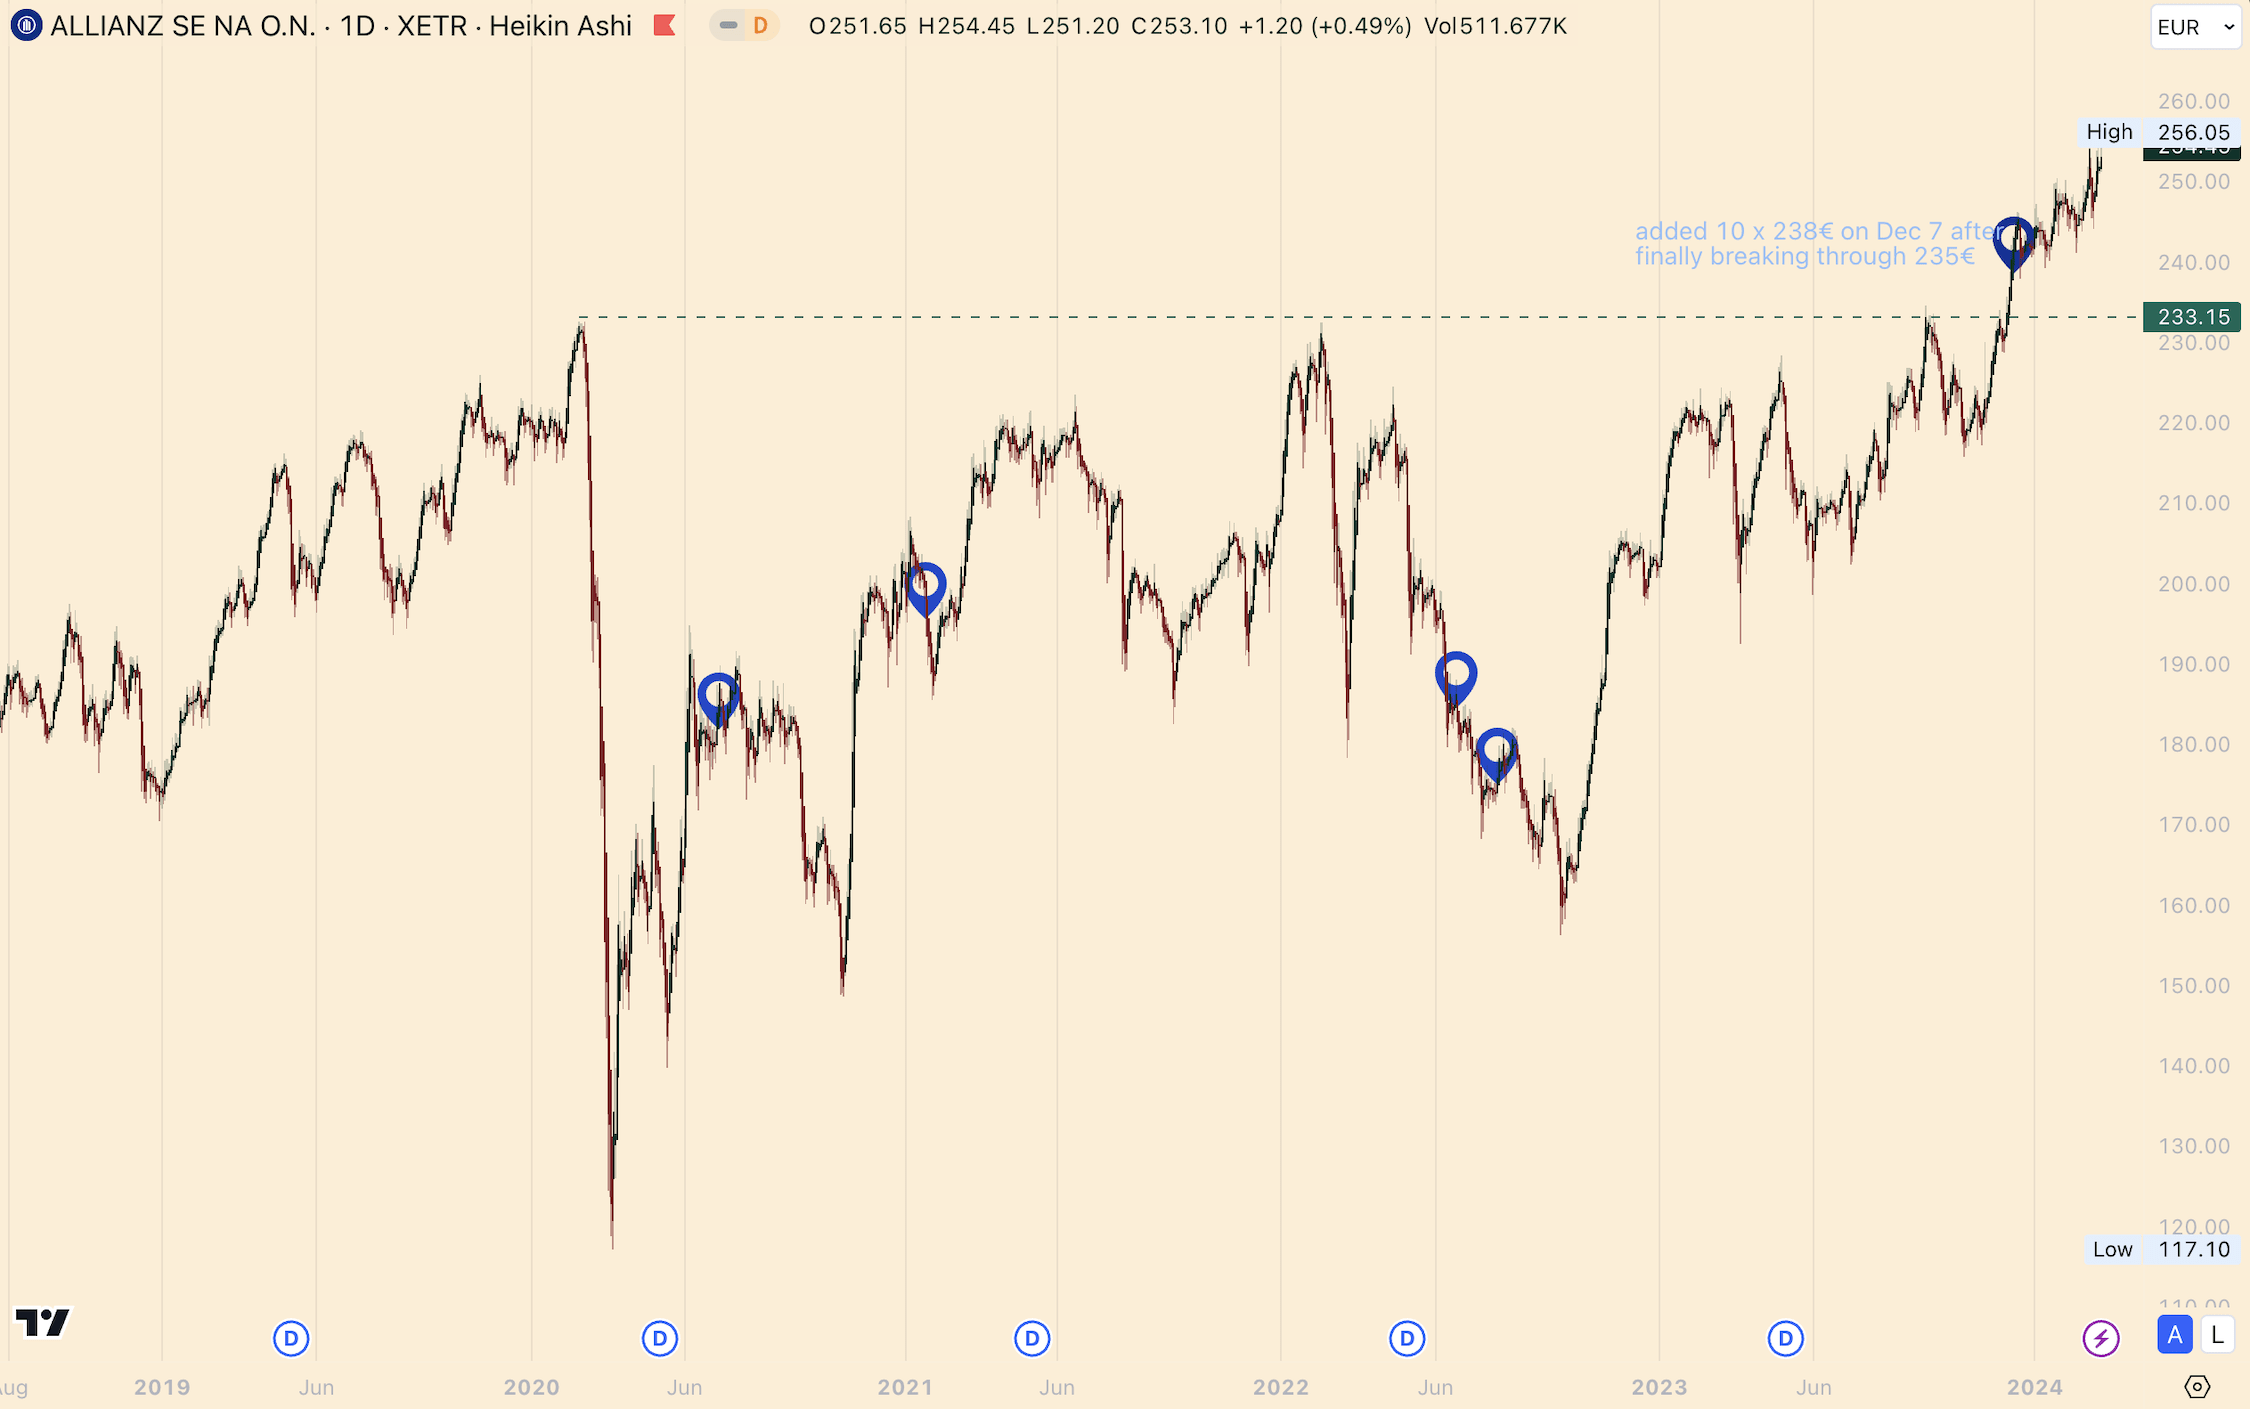
I made some purchases whenever the stock had a down day, and once it was able to break through 233€, and stayed above for two full days, I added to my position.
It then quickly added another 20€ and the old resistance now became a strong support.
Best Practices For Short-Term Trading
I use different TradingView chart settings for short-term trading, regardless if I trade stocks in my trading account or crypto in my crypto portfolio.
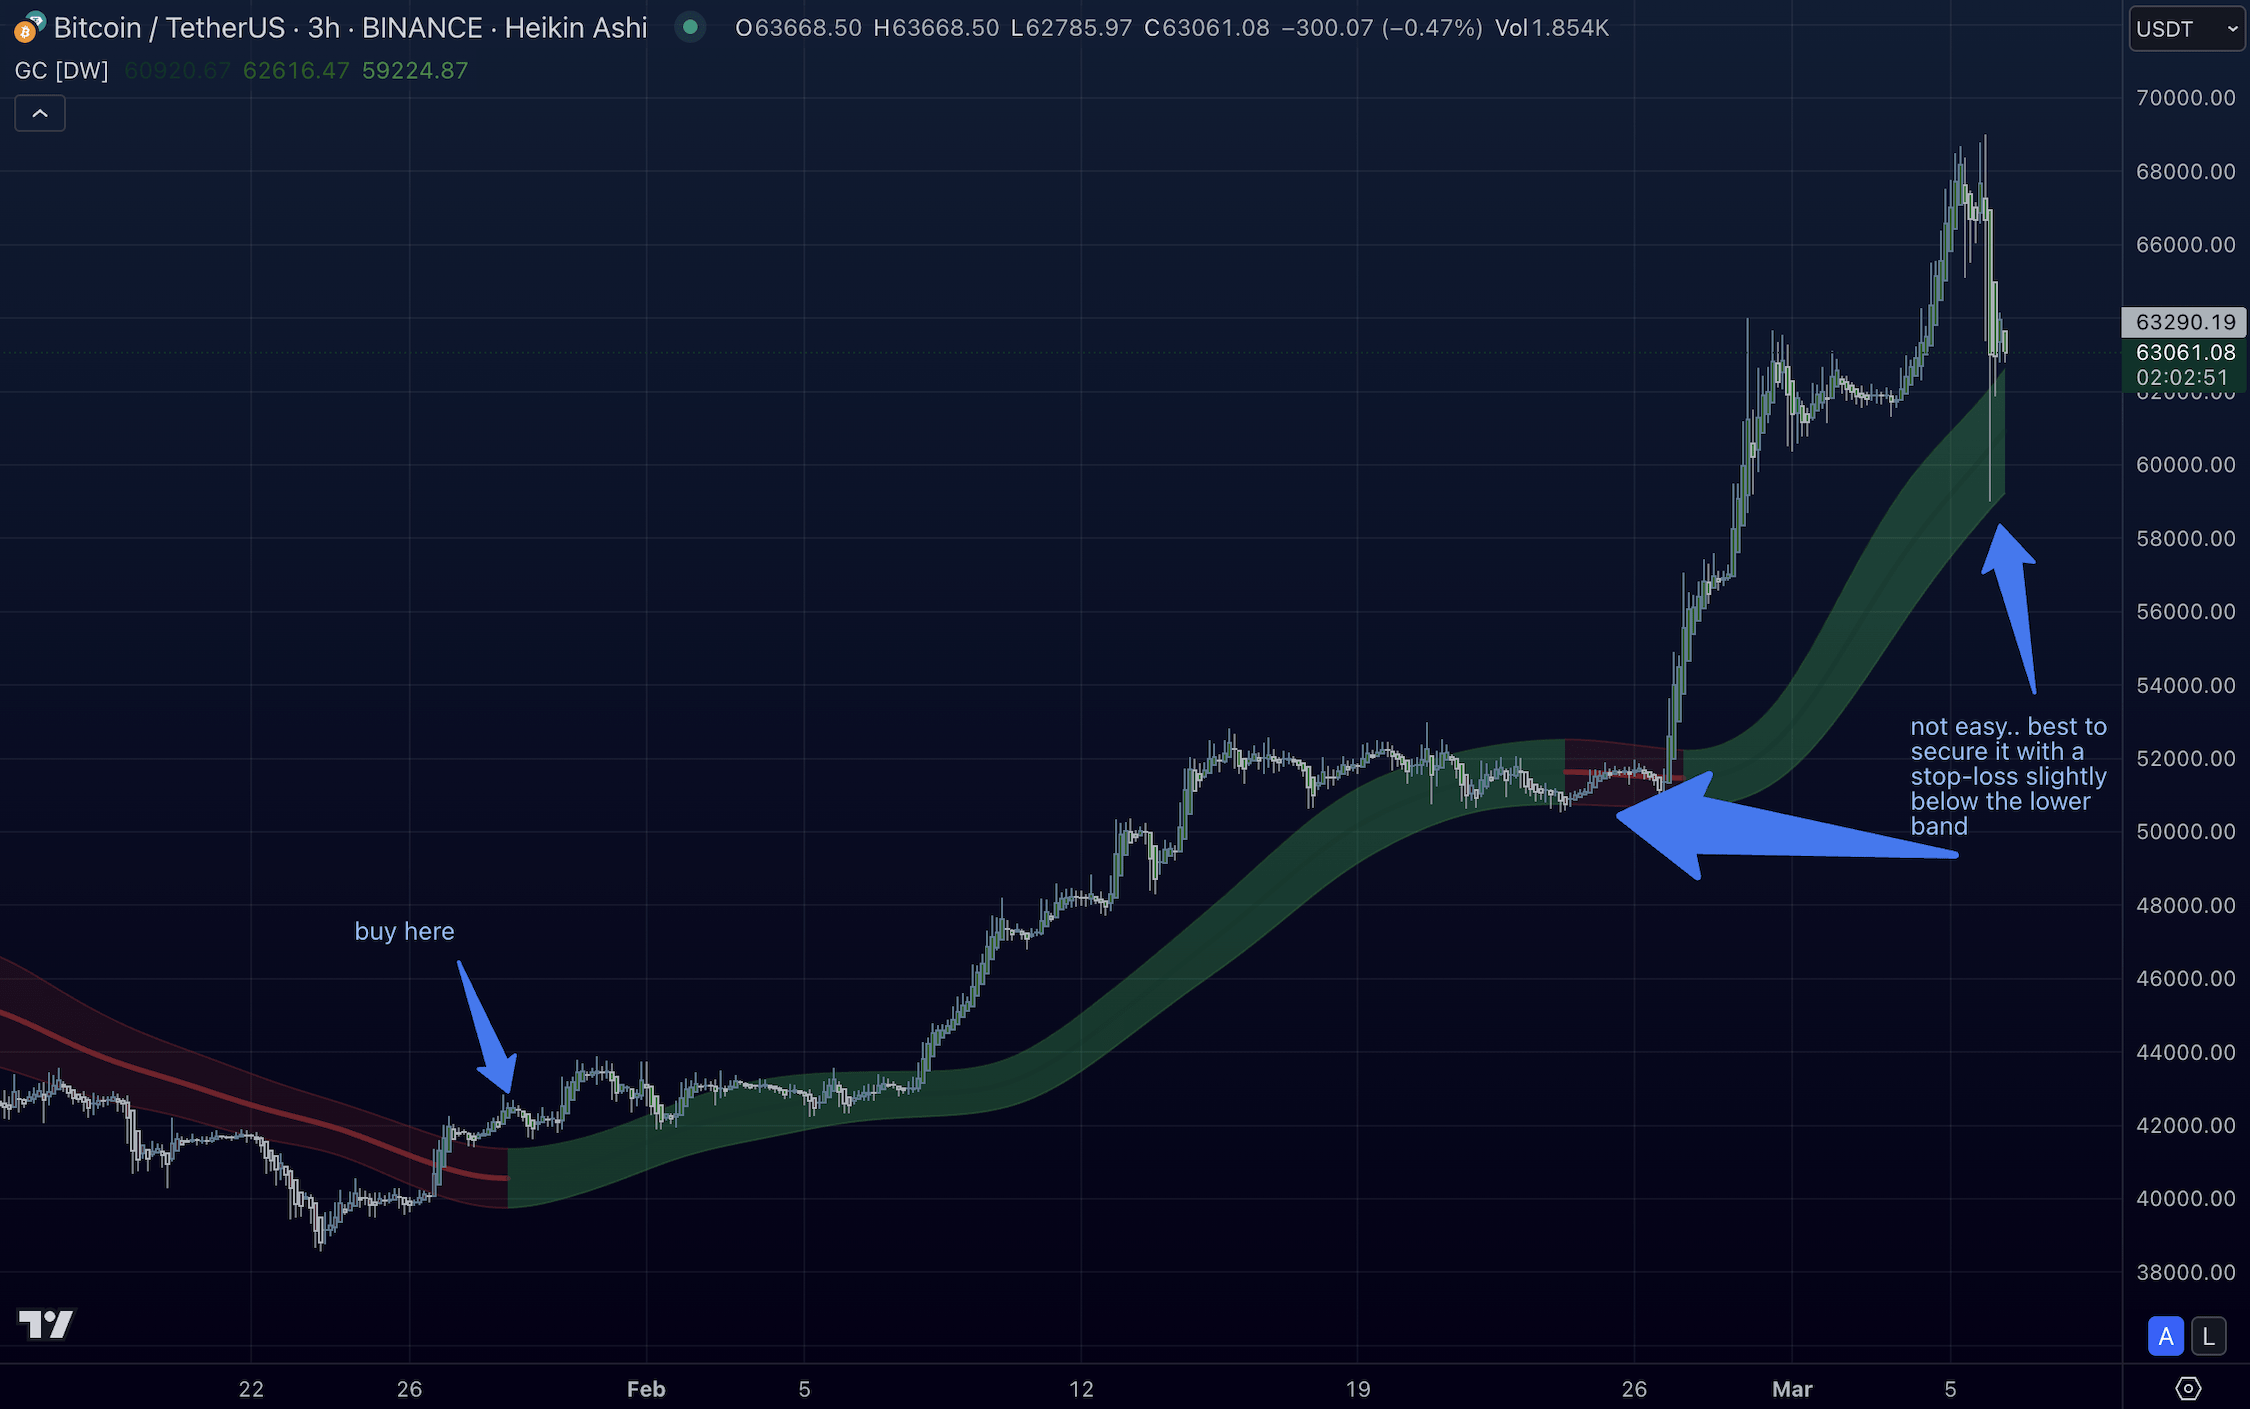
For lower time frames, I use the 3-hour time frame and work with the Gaussian Channel indicator.
I like the simplicity of using it:
- Open a position once the price is above the channel and flips green.
- Close your position once the price leaves the channel to the downside.
- Then wait, rinse, and repeat.
Below is an example of this strategy for the MATIC price chart.
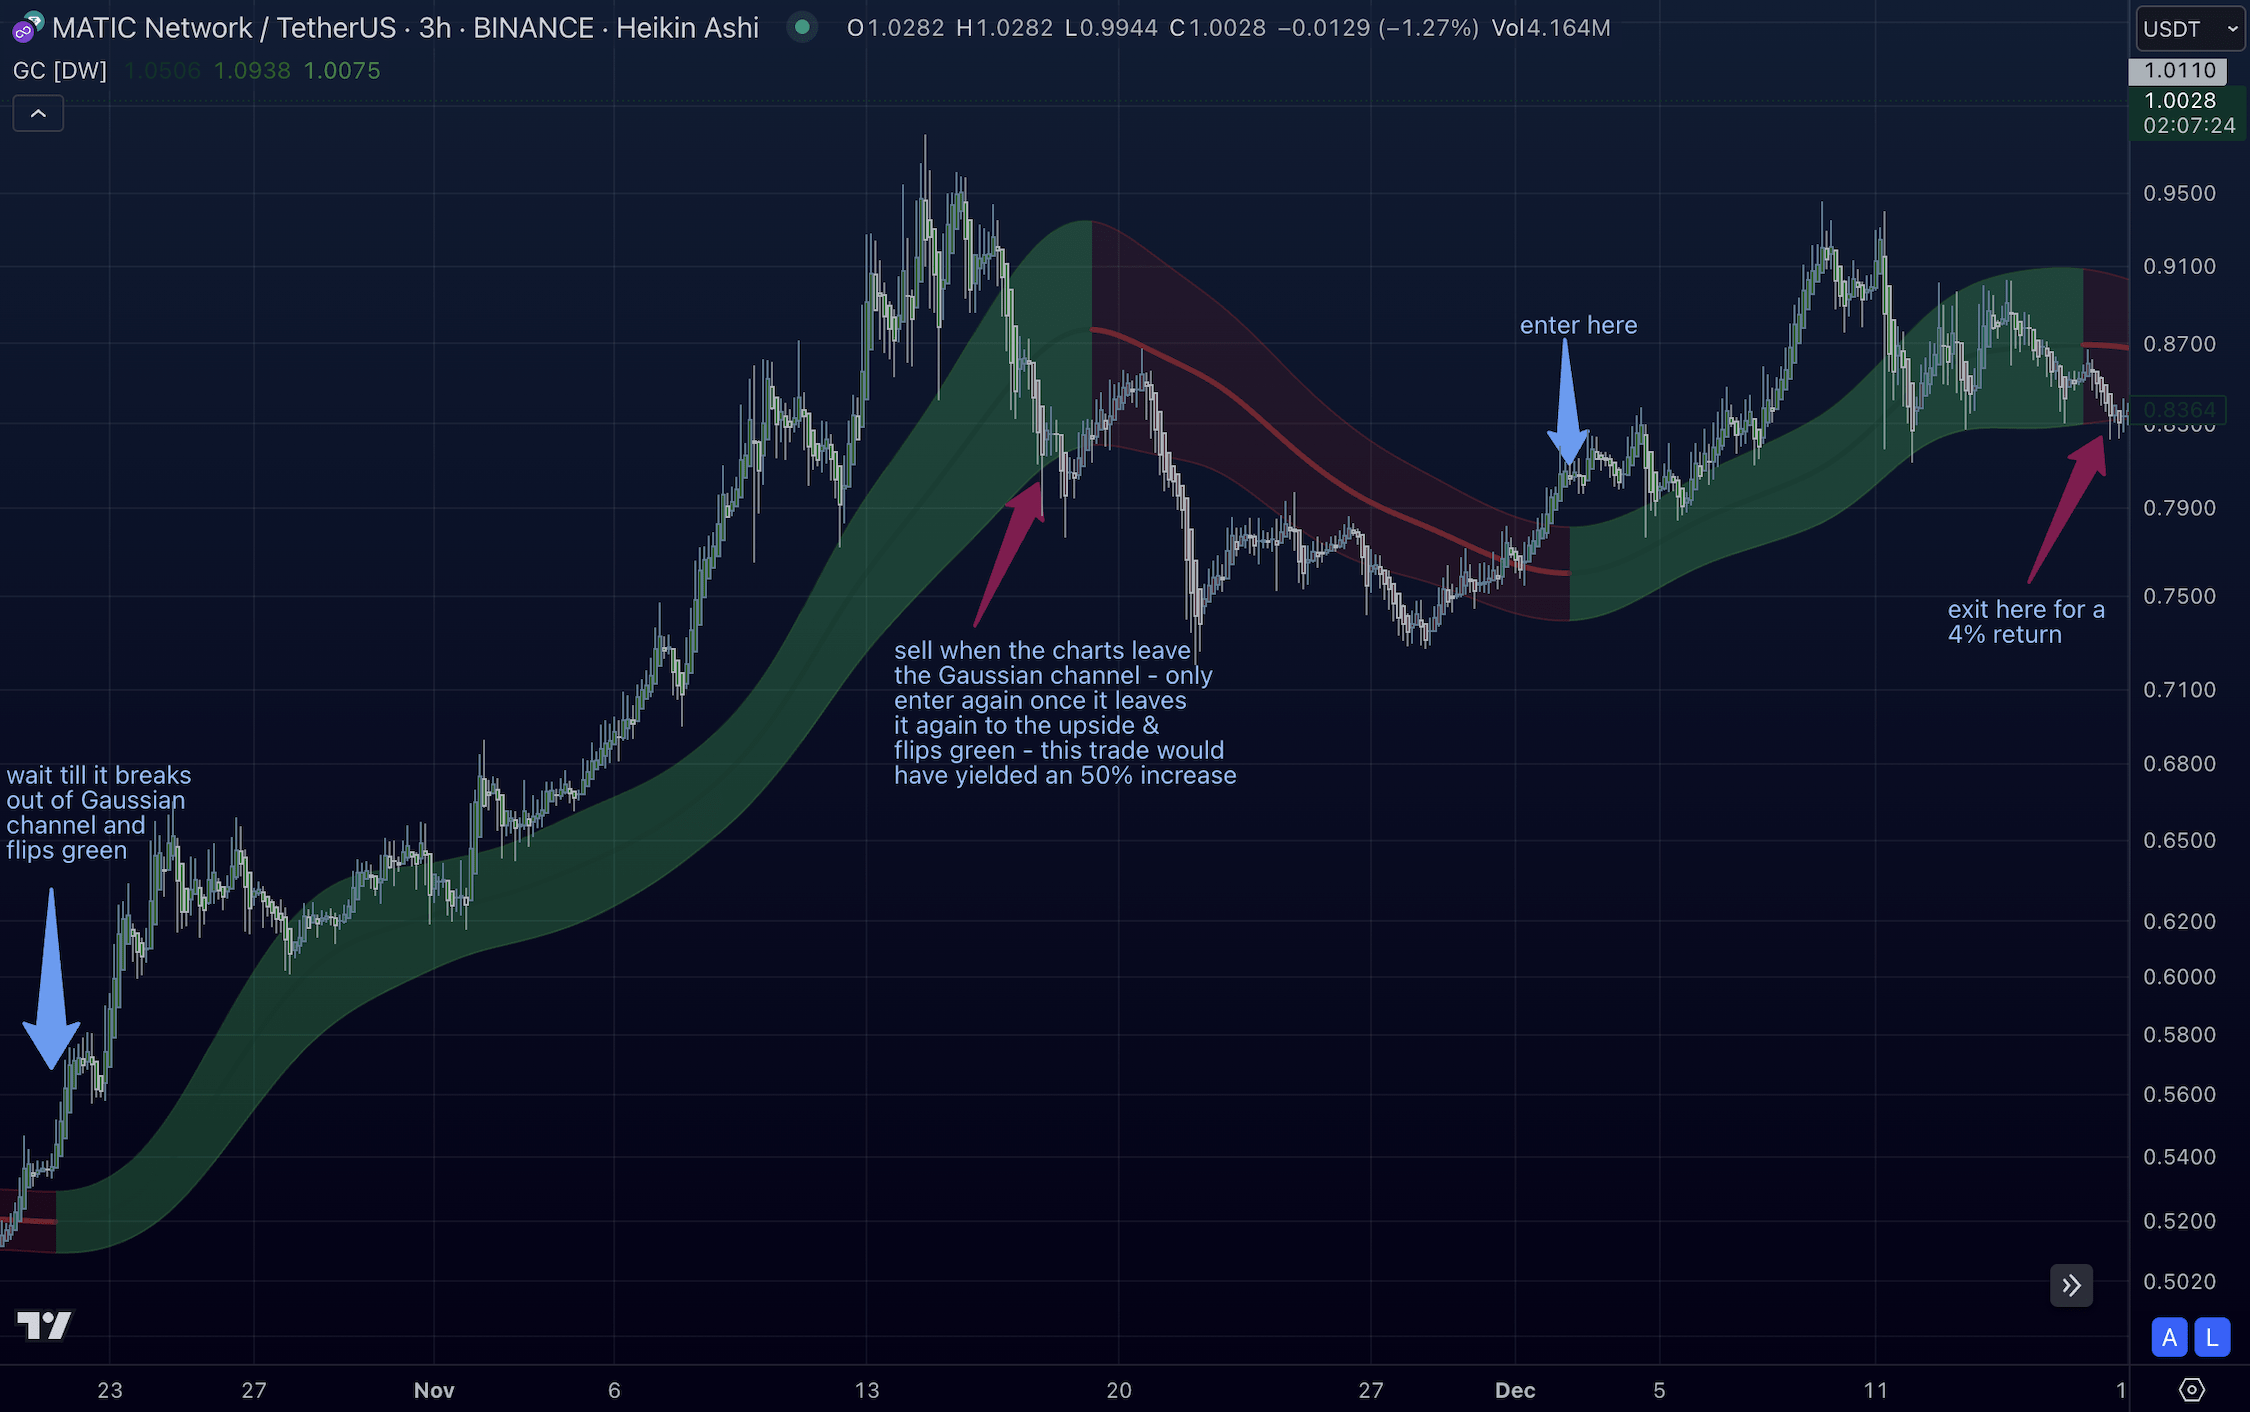
This does not always work, but at least I am using a clear system I follow, which protects me from nasty downturns.
Another example, this time from Bitcoin, below:
Does Technical Analysis Work?
Before we get started, let’s do a quick test.
Take a look at the following first image. What do you see?

Now take a look at this image. Again, what do you see?

Did you see both the rabbit and duck, as well as the flower vase and faces?
Warren Buffett shares these examples when explaining why he believes technical analysis does not work because every investor “sees whatever they want to see”, listen to him explain it himself:
Quintessentially, every investor sees and analyzes technical charts subjectively, and therefore, draws different conclusions.
I undeniably benefited from following certain best practices, which I like to share below.
Conclusion
Mastering technical analysis with the help of TradingView ‘s Essential plan empowers investors to make informed decisions in dividend stock and crypto investing. Get $15 USD off when signing up through this link.
By embracing simplicity, adhering to best practices, and acknowledging the subjective nature of technical analysis, investors can navigate the markets with more confidence.
📘 Read Also
- How I Manage My $1.5M Crypto Asset Portfolio
- The Best Disruptive Tech Fund To Buy
- Financial Astrology – Investment Guide For the Age of Air
FAQ
Does technical analysis work?
Technical analysis is subjective; its effectiveness varies among investors. It’s about interpreting patterns, indicators, and trends to make informed decisions.
What are the best TradingView chart settings for the long term?
What are good TradingView chart settings for short-term trading?
For short-term and momentum traders, consider using the 3-hour time frame and Gaussian Channel to find good entry/exit points. Short-term traders may also benefit from using stochastic oscillators to capture shorter-term price movements.
How to use technical analysis when investing?
Utilize technical analysis by studying price charts, identifying patterns, and using indicators to assess market sentiment, trend direction, and potential entry/exit points. It’s crucial to combine technical analysis with fundamental analysis for comprehensive investment decisions.
How to check the Tradingview chart of the Nifty Index?
The Nifty Index, containing the 50 largest stock-listed companies in India, is one of the most popular charts on TradingView, you can check it out here.