Passive Income Tracker – $1,860 Received, $15,000 Invested
August was an unspectacular but good month nevertheless.
I received $1,860 US in pure, sweet passive dividend income.
My biggest payer was my favorite Indian REIT, CapitaLand India, which paid out $547 US.
The second-largest payer was another REIT from another corner of the world – my only Australian REIT called Dexus.
In 2023 in total, I so far earned $18,800 US in dividends.
Dividends Received in August
My passive income tracker for August 2023, with dividends from nine great companies:
| Date | Dividends | Shares | Amount |
| 2023-08-31 | 🇮🇳 CapitaLand India | 22,300 | $547 🛑 |
| 2023-08-31 | 🇦🇺 Dexus | 2,900 | $332 🛑 |
| 2023-08-24 | 🇸🇬 DBS | 600 | $208 ⬆️ |
| 2023-08-16 | 🇺🇸 PG | 125 | $106 ⬆️ |
| 2023-08-15 | 🇺🇸 AbbVie | 145 | $182 ⬆️ |
| 2023-08-15 | 🇺🇸 Realty | 429 | $93 ⬆️ |
| 2023-08-08 | 🇺🇸 Deere | 18 | $19 ⬆️ |
| 2023-08-01 | 🇭🇰 Link REIT | 1,500 | $225 🛑 |
| 2023-08-01 | 🇺🇸 AT&T | 625 | $147 🟧 |
| Total | $1,860 | ||
| Dividends ⬆️ increased 🟧 unchanged 🛑 lower | |||
The symbols behind the $$ amount indicate whether the dividend was ⬆️ increased, remained 🟧 unchanged or is 🛑 lower compared to one year ago. As you can see, all REITs, usually the most stable dividend payers, all have lower dividends!
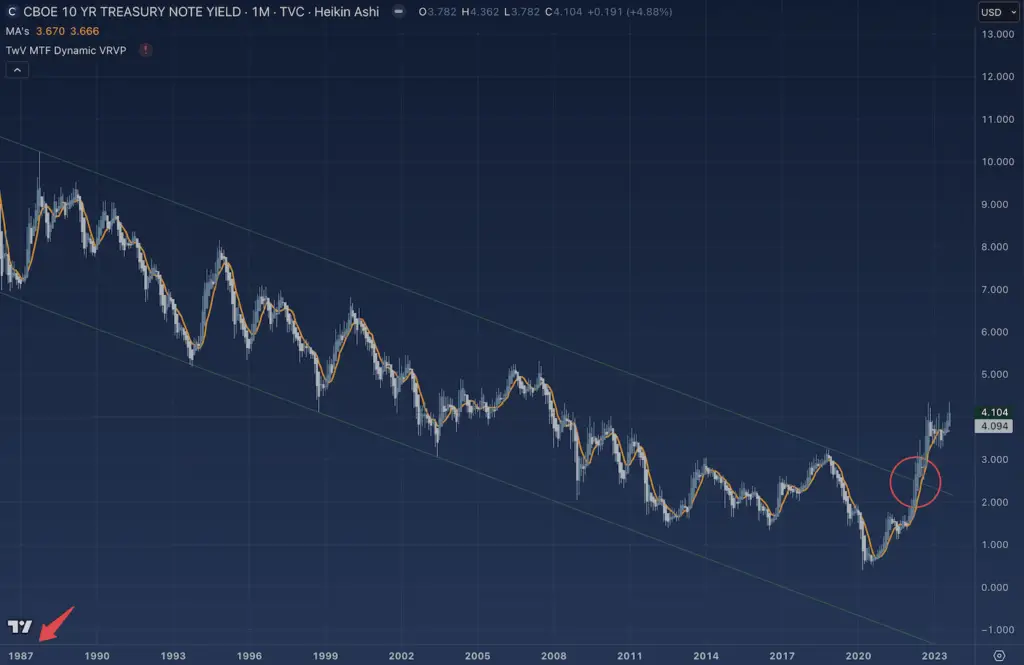
This is of course mainly due to the rising interest rates that broke out, as shown on below’s chart.
My favorite European REITs Vonovia and Aroundtown are up 50% from the lows and I believe the lows are in.
Share Purchases In August 2023
In August, I put $15,440 US to work, and added to the following of my existing positions:
| Date | Buys | Shares | Amount |
| 2023-08-26 | 🏴 Scottish Mortgage Trust | 750 | $6,334 |
| 2023-08-21 | 🇺🇸 Realty | 6 | $346 |
| 2023-08-03 | 🇦🇺 Rio Tinto | 40 | $2,505 |
| 2023-08-03 | 🇨🇦 Enbridge | 20 | $721 |
| 2023-08-02 | 🇭🇰 Link REIT | 1,000 | $5,535 |
| Total | $15,440 |
I am almost done building the $50,000 position in Scottish Mortgage Trust. I now own 5,500 shares and invested a total of $46,000. The chart below shows all of my purchases.
My passive income tracker usually covers the income I get from the dividend stocks I own in my All-Weather Portfolio, but this month I also like to share the income I generate from cryptocurrencies.
Passive Income Tracker – Month by Month
Let’s take a look at how my passive income develops over time, comparing the monthly income month by month.
Important to note that the improvement each month has a lot to do with the amount of new capital I deployed. Of course, it also has to do with increased dividends, but as I currently am still building my dividend portfolio, the main reason is additional capital invested!
Dividend Portfolio – Each Position
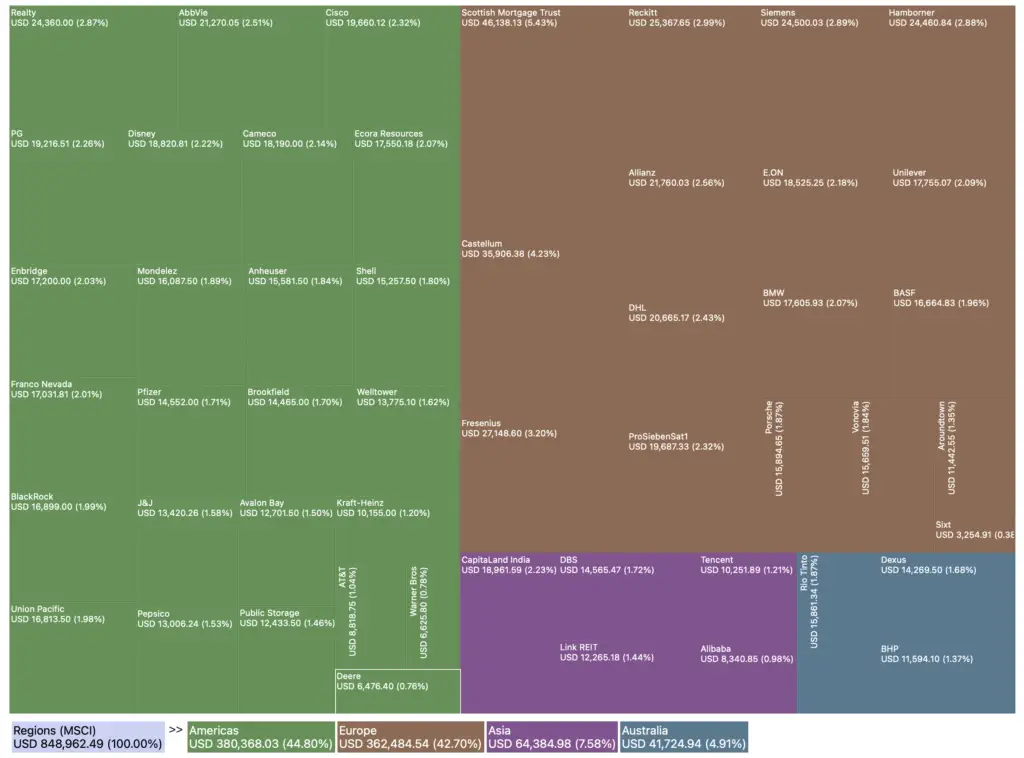
My portfolio value currently sits at approx. $850,000 US. Below is a full breakdown:
Dividend Portfolio – By Region
Also interesting is to look at the geographic distribution, see the chart below.
44% of my dividend portfolio is invested in U.S. stocks, 42% in Europe, and about 12% in Asia-Pacific.
Income From Cryptocurrencies
In August, I generated a total of $1,760 US via my cryptocurrencies. About half via simply staking the coins I own, and the other half via fees generated from LPing (providing liquidity to Liquidity Pools).
Income from Liquidity Farming
| Bake on DefiChain | $285 |
| SaucerSwap | $210 |
| Osmosis | $197 |
| Heliswap | $122 |
| Total incl. others | $824 |
Income from Staking Rewards
| Hedera | $198 |
| Cosmos | $294 |
| Solana | $124 |
| Ethereum | $124 |
| Nexo | $68 |
| Polkadot | $45 |
| Radix | $30 |
| Heliswap | $12 |
| Perion | $10 |
| Total incl. others | $937 |
The above is purely passive income, meaning I don’t have to do anything other than claim the rewards at the end of each month.
It takes me about an hour to quickly claim and re-invest the staking and farming rewards.
I have a Passive Income Tracker sheet you can download for free when signing up for my email list via this link.
Digital Asset Portfolio
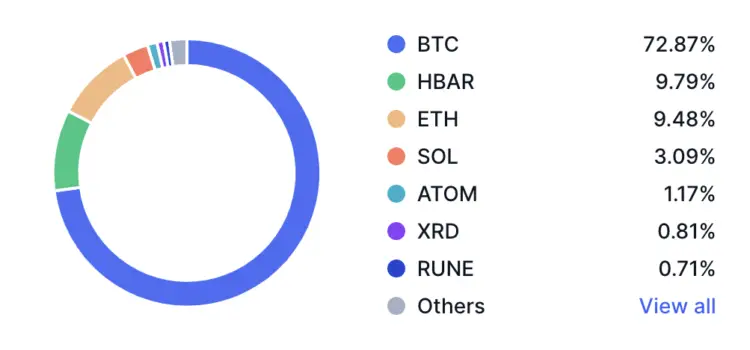
My current digital asset portfolio looks like this:
72% of my portfolio is in Bitcoin, then Hedera, Ethereum, and Solana. I also have a small position in Cosmos with its native coin ATOM, and Radix, with its coin XRD.
Conclusion
A normal and sort of uneventful month. The total passive income I generated in August was $12,200 (click here to unlock the full breakdown).
In August, I spent $13,000 on our family vacation in Germany, Austria, and Italy, leading me to think about whether Europe has the potential to become a dream destination for remote workers.
For the time being, I’ll keep re-investing the generated passive income as well as investing new capital into both the stock and crypto markets.
FAQ
How to create a passive income tracker?
Keep things simple and open a new Google Sheet file. From the left to right, write the months. From up to down, write the different sources of the passive income you generate. This is the easiest and fastest way to create your own passive income tracker, or you use mine (unlock here).
What is the best income tracker app?
There are many good options out there. Mint.com is good. Personally, I use a simple Google Sheet (make a free copy here), and for daily family expenses, I use a simple mobile phone app called MoneyControl.
What is an income tracker?
It tells you what income you generated via which income stream, ie. from your salary, or passive income from collected rent, royalties, blogging, dividend stocks, cryptocurrencies, etc. It’s important to keep track of both your actively-generated and passive income, as well as your expenses to see if you actually make or loose money. A prudent suggestion is to save up enough money that you could get by for six months without generating any income, and then invest the rest. Also, always try and save at least 5%, better 10-20% of your after-tax salary. Read this article to learn how to get started with investing.



 Age when reaching FI: 40 in 2018
 Left the rat race: May 2017
 Living in: Singapore
 Number of kids: 2


 Services I Love


